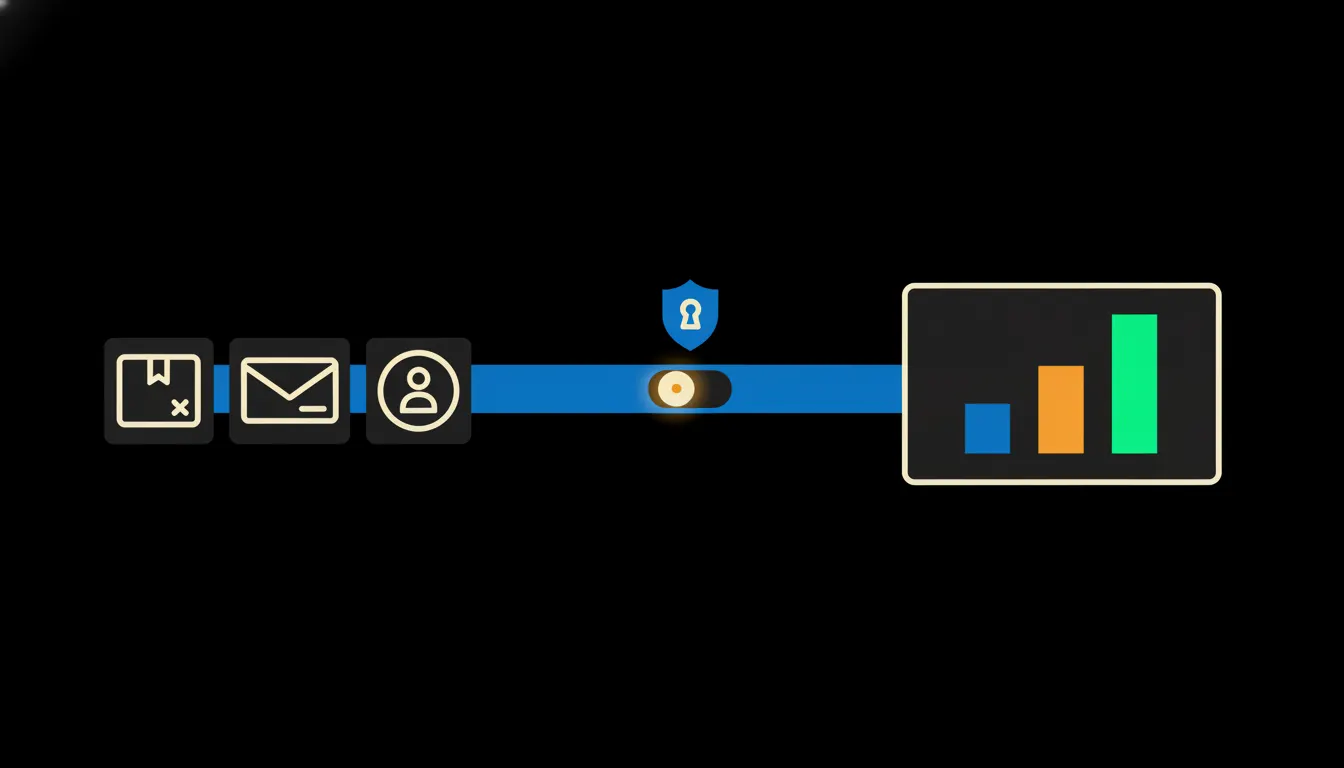
You want a CRM report on returned goods, and you find out the CRM knows almost nothing about returns. The return is recorded in the e-shop, the reason is in an email and the customer is in the CRM. In a small company, the report that joins all three is put together by hand in a spreadsheet. If anyone puts it together at all.
The work nobody wants
At the end of the month someone asks why so much comes back. The answer exists, it is just scattered. The list of returns can be exported from the e-shop. Customers write their reasons into a form, an email or a note in the parcel, each in their own words: “wrong size”, “colour not like the photo”, “arrived damaged”. Who the customer is, whether this is their first order or their third, which campaign brought them in: that lives in the CRM.
Whoever wants the report opens three windows. They match order numbers to emails, sort reasons into categories by hand and look customers up one at a time. Two evenings later they have a table that holds for one month. Next month it starts again. So most small companies never build the report, and all they know about returns is that there are probably more than last year.
“It is mostly the women’s jackets coming back. Or was it the men’s shoes? I will look into it when there is time.”
— A meeting at a small e-shop, abridged
What connecting Claude to returns actually means
Claude reads free text and sorts it well. It understands that “tight in the shoulders” and “I will order one size up” mean the same thing: size. That is the easy part. The hard part is that Claude has no access to the returns, the inbox or the CRM on its own. The model is not the bottleneck. The gap between Claude and the data the company already has is the bottleneck.
MCP servers close that gap. Each one is small and does one job: one reads returns from the e-shop, one reads the returns inbox, one reads customers from the CRM. Every request carries the identity of the person asking. Nothing gets copied and no new database appears. Claude reads the data at the moment it needs it, and answers.
Concretely: Shoptet, a shared inbox and Raynet
Picture a small clothing e-shop on Shoptet, with customers in Raynet CRM and return emails landing in a shared Microsoft 365 inbox. None of that changes. Three MCP servers get added, plus one question in plain language: “Which products came back most often last quarter, for what reason and from which customers?” For an e-shop with a few hundred returns a quarter, this is work nobody currently has time for (figures are illustrative).
- Matches every Shoptet return to its order and to the customer in Raynet, using the order number and email address.
- Reads reasons from forms and emails and sorts them into a few plain categories: size, looks, defect, delivery, changed their mind.
- Groups customers by what the CRM knows about them: new, returning, wholesale, order source.
- Returns a list of products and customer groups ranked by number of returns.
- Shows, for every figure, which returns and emails it rests on, so it can be checked.
An illustrative example: a two-person team in Brno sells children’s shoes. The report could show them that most returns of one model come from new customers out of a single campaign, and the reason is almost always “too small”. The customers are not the problem. The product page has no size chart and the ad promises more than the shoe delivers. Fixing it takes an hour. Without the report, nobody would have spotted it.
What an AI returns report will not do, and why that is good
Claude does not decide anything about returns. It does not approve credit notes, refund money or change your terms. The statutory 14-day withdrawal period and the refund deadline keep running exactly as before, and a person in your process keeps watching them. The bridge reads data. It does not write.
Claude also cannot know why a customer decided something they never wrote down. If a third of the returns have no reason, the report says so and does not fill the gap with guesses. That is why you can trust it: every figure stands on specific records, and the call on what to do about a product stays with you.
What it would take
Not a year-long project. First we walk through where your returns, reasons and customers live, and who is allowed to see what. Then we build three small MCP servers and deploy them on your infrastructure, under your identity, with one audit trail. The finished question goes into the skills library, so anyone with the right permissions can run the monthly returns report without a spreadsheet and without waiting for a colleague.
What is left
Returns will not disappear. The guessing about where they come from will. Claude can already read messy reasons and long order lists. What it lacks is a road to the data you keep in the e-shop, the inbox and the CRM. That road is what we build.
Write to us, a short call is enough. We will show you what a returns report would look like on top of your own data.