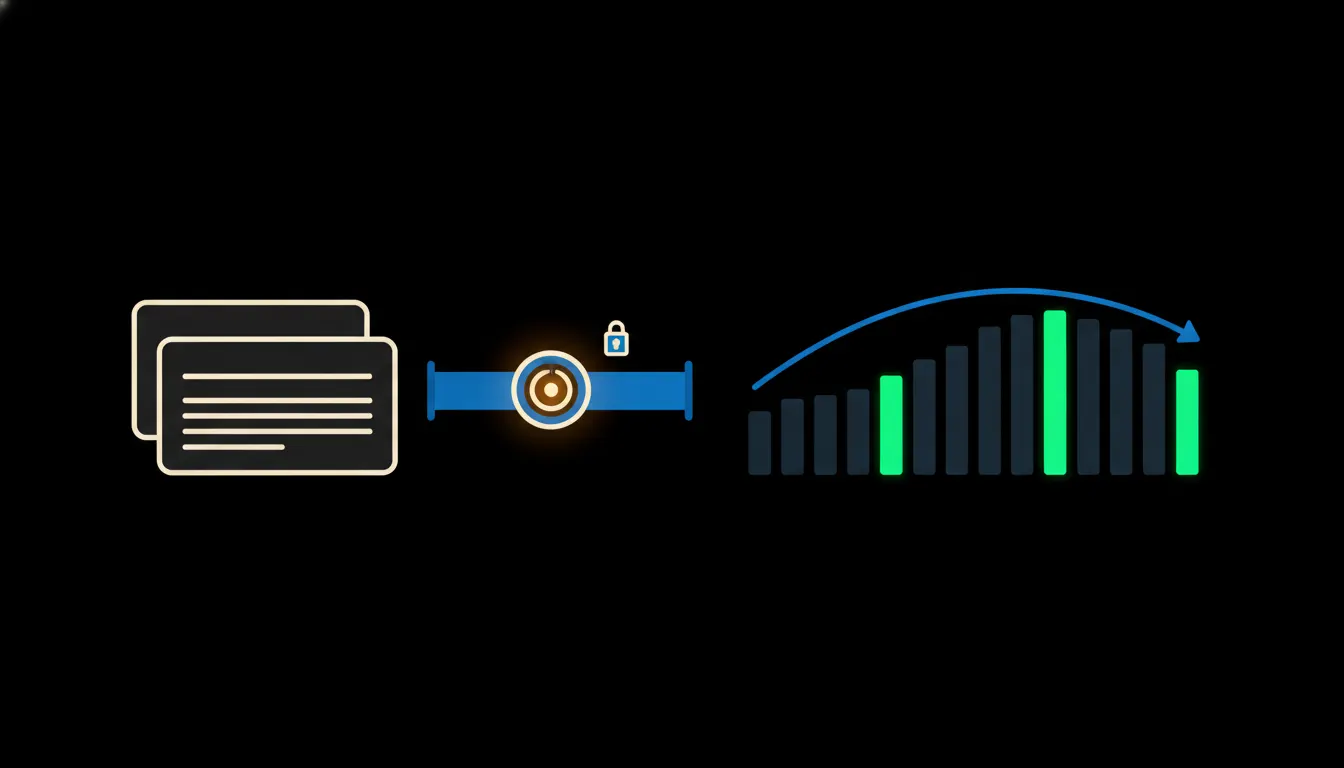
Any company that orders December stock in November needs CRM reports on sales seasonality. Most smaller firms only sense theirs: “summer is quieter”, “it picks up before Christmas”. Give Claude access to the CRM and the books, and that hunch becomes a month-by-month view you can plan stock, staff and campaigns against.
The work nobody wants
The answer to “when do we sell the most” usually exists. It is just scattered. Deals and closed orders live in the CRM, issued invoices in accounting, returns and credit notes somewhere else again. Seeing three years by month means exporting, matching customer names, subtracting cancellations and building a pivot table by hand.
So it happens once a year, if at all. The result is a spreadsheet one person built, on one day, with one view of the data. A month later someone asks how a particular product line or region behaves, and it starts over. Meanwhile the stock plan is made from the owner's memory.
“Last March was weak, I think. Or was that the year before?”
— A purchasing meeting, abridged
What having seasonality measured actually means
Measured seasonality means the question “what does our year look like” is answered by data, not recollection. Claude connects through a small MCP server to the CRM and the accounting system and reads only what it needs: closed deals by date, invoiced revenue, credit notes. It keeps no copy of the database. It asks fresh every time, so the answer reflects this morning's state.
Who is asking matters. The bridge carries the identity of a specific person. The sales director sees the whole sales team, a regional manager their own region, the owner everything. So Claude is not producing one universal report that someone has to clear for distribution. Each person gets a view of what they can already open in the CRM today.
Concretely: Raynet CRM and Pohoda
Take a company that runs sales in Raynet CRM and keeps its books in Pohoda. Both systems stay exactly as they are. Nobody learns anything new and no data moves. What gets added is a bridge that lets Claude read deals from the CRM and invoices from Pohoda and put them side by side. For a firm issuing a few thousand invoices a year, that is a volume a person would grind through over days, and Claude works through it within a single question (illustrative).
- Totals closed deals and invoiced revenue by month for the last two to three years, net of credit notes.
- Separates the recurring pattern from one-off spikes, such as a single large order that would otherwise distort a whole month.
- Breaks the curve down by product line, region or customer type, if your CRM records them that way.
- Compares open deals in the CRM against last year's run and flags it when this season is starting later or weaker.
- Prepares the groundwork for a plan: when to order stock, when to add shifts, when to launch a campaign and when to expect the slowdown.
An illustrative example: a small garden-equipment wholesaler in South Moravia knows spring is strong. The data might show that one product line actually peaks in February, because the shops that buy it stock up early. That moves the supplier order date by a full month. A hunch will not catch that. A monthly breakdown will.
What a seasonality report will not do, and why that is good
Claude does not decide how much stock to order or whom to hire for the season. It shows the pattern, the uncertainty around it and the places where the data is thin. If the company has only one year of history, it says so plainly and does not pretend to forecast. Decisions about money and people stay with whoever is accountable for them.
Nor will the report fill in what the systems are missing. If deals are logged in the CRM inconsistently, Claude shows that as a gap, not as a drop in sales. That is exactly why the report can be relied on. A number whose origin you know can be defended in a meeting and in front of the bank.
What it would take
No year-long project. It starts with a short conversation about where your deals and invoices live and who has access to what. Then we build two small MCP servers, one for the CRM and one for accounting, and deploy them on your infrastructure. Everything runs in one tenant with one audit trail, so you can see who asked what. Once the seasonality report works, the team saves it as a skill and runs it the same way every month.
What's left
Claude is already good at counting and explaining. The model is not what keeps a company from seeing its own year. The gap between Claude and the data already sitting in your CRM and your books is. We close that gap.
If you plan stock or shifts on last year's feeling, write to us. In a short call we will walk through where the data would come from and what you would see first.