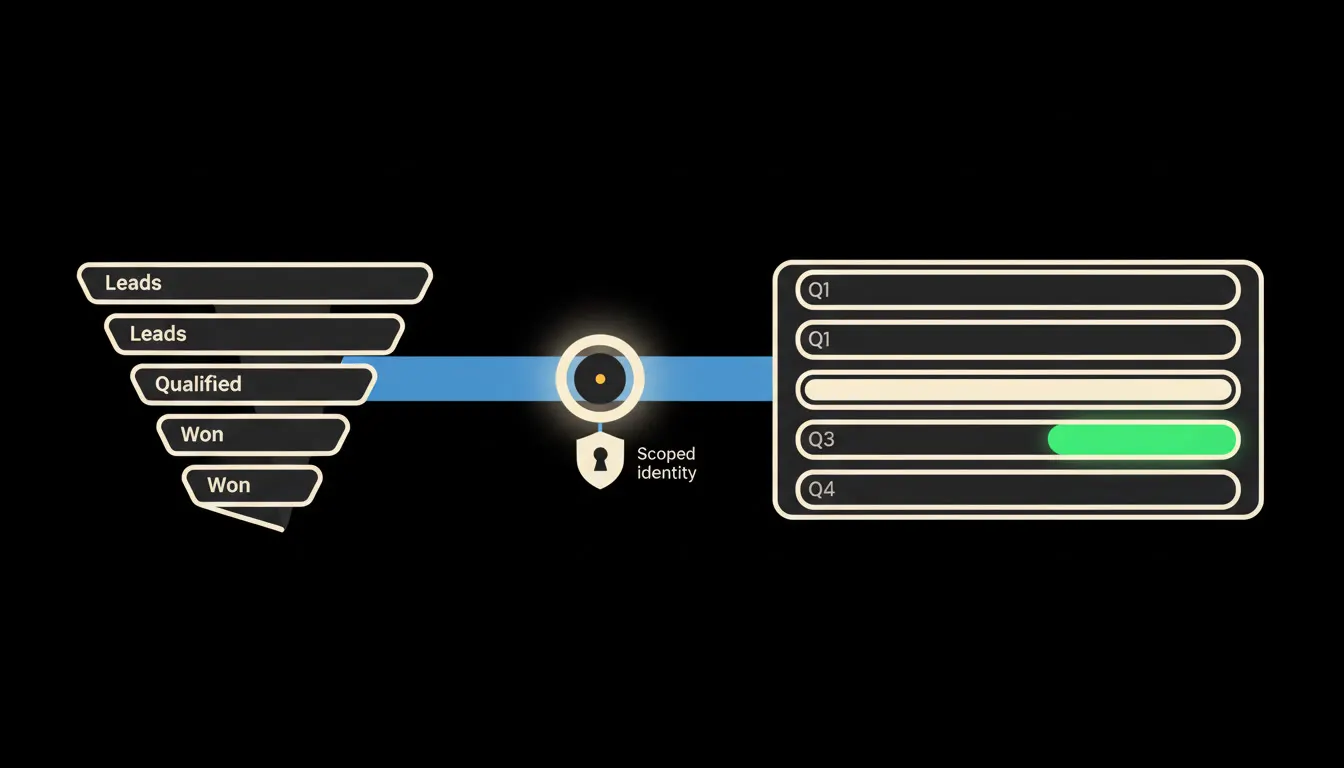
Most CRM pipeline reports get made the same way: on Friday afternoon someone exports the open deals to a spreadsheet, colours them by hand and multiplies them by a guess they don't quite believe. Yet everything a sensible quarterly forecast needs is already in the CRM. Open deals, their stages, their dates, and the history of what actually closed. What's missing is someone to put it together. That can be Claude, connected straight to your CRM and working under your permissions.
The work nobody wants
It starts with an export. Say a hundred and forty open deals, each with an amount, a stage and a close date the rep filled in when the deal was created and never touched again. Then comes the spreadsheet, with formulas written two years ago by someone who has since left. “Proposal sent” is weighted at 50 percent because somebody once said so.
The second half is worse. The sales director walks the floor asking whether the deal with the machine shop in Brno will really land before the end of March. Everyone answers a little optimistically, because nobody wants to be the one who pulled the number down. The result looks fine on Monday and falls apart in the third month of the quarter. And nobody can say which three deals it was resting on.
Half the pipeline has a close date in the past. The other half is waiting for “next week”.
— The Friday export, abridged
What connected actually means
AI stack builds a small MCP server, a bridge between Claude and your CRM. The bridge can read deals, stages, activities and the history of closed business, and nothing else. It always asks under the identity of the person who wants the forecast. A rep sees their own deals; the sales director sees the whole company. Nothing gets copied anywhere: Claude reads the data at the moment it needs it, and the answer is produced on your own infrastructure.
The idea behind a weighted pipeline is simple. A deal worth a million, sitting in a stage from which you historically win one in three, counts in the forecast as roughly a third of a million. What changes is where the weights come from. You write the method down once as a skill in your team library: weights from your own close history, a deal goes stale after a month of silence, conservative and likely scenarios kept apart. The skill is versioned. When the finance director adjusts it in April, the whole sales team forecasts by the new version the next morning, and the spreadsheet inherited from a predecessor can go to the archive.
Concretely: Raynet, Pipedrive or HubSpot
If your sales team works in Raynet, Pipedrive, HubSpot or a custom-built CRM, that CRM stays exactly as it is. Reps keep creating deals and moving stages. What gets added is the bridge and the skill. For a company with a few hundred open deals, that usually means one MCP server and one skill, not a new system. On request, the skill does this:
- Pulls the open deals with a close date in the quarter, including the ones that should have closed long ago.
- Works out from your CRM history how many deals from each stage you actually won over the last two years, and uses those weights instead of guessed ones.
- Flags deals with no activity for a month, or whose close date has moved more than twice.
- Compares past forecasts with what was actually invoiced in Pohoda, so you can see how far your pipeline usually drifts.
- Returns two numbers, conservative and likely, plus a short list of the deals the result leans on most.
Picture a company with eight reps selling service contracts for industrial cooling. On Monday morning the managing director asks Claude: “How does the second quarter look?” The answer is a range, a note that four of the ten largest deals have had no activity since February, and five deals that make up more than half of the likely scenario. It's an illustrative example, but the shape of the answer is what the skill returns. The director doesn't call all eight reps. He calls three.
What a pipeline forecast won't do, and why that's good
Claude doesn't know the future. It can't know that a customer is changing buyers, or that a competitor just came in fifteen percent cheaper. The estimate rests on what's in the CRM, and if reps don't update their stages, the forecast won't fix that. What it can do is show it. Stale deals and slipping dates appear in the overview before they turn into a hole in the number.
The second limit is deliberate. The bridge writes nothing to the CRM. Claude won't move a deal to another stage or rewrite a date, even where the data suggests it should. The number the managing director gives the bank or the co-owners is his decision. Claude gives him a basis he can stand on and shows him where the ice is thin.
What it would take
We start with a short call about how you forecast today and who reads it. Then we connect your CRM through one MCP server on your own infrastructure, under your people's identities, and write the first version of the skill with you. This is not a year-long project. It's a few weeks, during which you check the first forecast against how last quarter actually ended and tune the skill accordingly.
What's left
The model is not the bottleneck. Claude can compute the weights and read the reps' notes. The bottleneck is the distance between Claude and the data already sitting in your CRM, plus a method everyone runs a little differently. The bridge closes the distance and the skill makes the method one.
If your Fridays revolve around exporting the pipeline, write to us. A short call about where your sales data lives and how the forecast gets made today is enough. After that we can tell you plainly what connecting it would take.