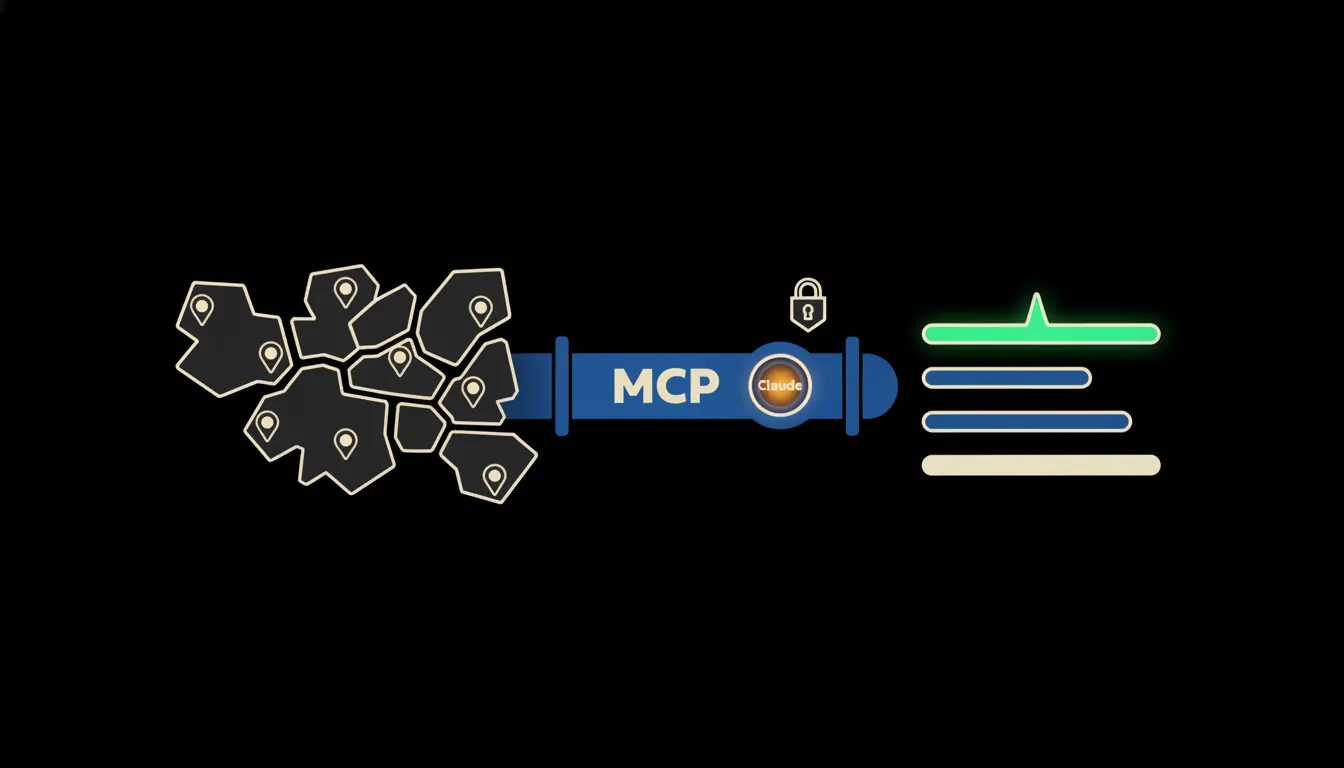
CRM reports by region exist to answer a single question: in which region do you actually sell, and where do your reps only drive. In most smaller companies nobody has that answer at hand. The data is there, it just sits in three systems, and turning it into a map of performance costs an evening of exports and pivot tables.
The work nobody wants
Picture a sales team of five covering the whole Czech Republic. Visits and calls go into the CRM. The accountant issues invoices in Pohoda. Mileage lives in a logbook that everyone keeps slightly differently. When the director asks whether two trips a week to the Zlín Region pay off, the manual puzzle begins.
Someone exports activities from the CRM, someone else pulls revenue from accounting. Customers are matched by company ID, because names are spelled differently in each system. Addresses get assigned to regions, and half of them are missing, or the customer is registered in Prague while the branch your rep visits is in Ostrava. The spreadsheet is ready in two days and stale within a month. So it gets done once a quarter, if at all.
We drive to Olomouc every week. None of us remembers why anymore.
— A sales meeting, paraphrased
What a connected CRM actually means
Connected does not mean one more system to retype things into. It means Claude gets narrow, supervised access to the systems you already run. For each one we build a small MCP server, a bridge that can read activities from the CRM, issued invoices from accounting and mileage from the logbook. Nothing is copied into someone else's database, and nothing is indexed into a vendor's cache.
The bridge carries your identity. When the sales director asks, she sees the whole country. When the rep for Moravia asks, he sees his region and his customers, exactly as he would in the CRM. A question like 'where do we get the most visits per crown of revenue' stops being a project. It becomes a sentence typed into a window, and an answer you can check straight away.
Concretely: Raynet, Pohoda and the mileage logbook
Take a combination many Czech companies run: Raynet CRM for sales, Pohoda for invoicing, and a mileage logbook kept in a spreadsheet or in the company-car app. Everything stays where it is. The only addition is a bridge between those systems and Claude. For a sense of scale, a company with five reps and a few thousand customers can produce tens of thousands of records a year, exactly the volume where matching by hand hurts and matching by machine is dull.
- Matches CRM customers to Pohoda invoices by company ID, not by name.
- Assigns each customer to the region of the branch your reps actually visit, not the registered office.
- Adds up visits, calls and kilometres per region and sets them next to revenue that was actually invoiced.
- Works out simple ratios: revenue per visit, kilometres per order, share of new customers.
- Flags inconsistencies, such as a customer with no region or an invoice with no rep, instead of quietly leaving them out.
As an illustration, an office supplies distributor in Brno could ask which three regions had the most visits and the least revenue over the past six months. The answer might show that Vysočina costs one rep a full day behind the wheel every week, while the South Moravian Region sends most of its orders by phone. That is a decision about routes, not about people, and it can be made on a Thursday morning instead of at the end of the quarter.
What AI reporting will not do, and why that's good
Claude does not know that you are just starting a relationship with a large buyer in the Pardubice Region who has not ordered anything yet. It does not know that the trips to Liberec are about a warranty claim, not a sale. The numbers show the imbalance. The explanation belongs to whoever was out in the field.
That is why the bridge only reads. It does not reassign territories, cancel visits in the calendar or write anyone a performance review. A suggestion that a route could be reorganised reaches the sales director as evidence. The decision and the conversation with the rep stay with him. That limit is the reason the report can be trusted: every number traces back to a specific invoice and a specific CRM record.
What it would take
We start with one connection and the one question you ask most often. The bridges run on your infrastructure, in a single tenant with a single audit trail, and every query is checked against your identity. It is a few weeks of work, not a year-long rollout. Once the report proves useful, we save it as a skill in your library, and on Monday morning anyone on the team can run it, always with their own permissions.
What's left
Working out revenue against kilometres is easy for the model today. Claude is not what slows you down. The gap between Claude and the data already sitting in your CRM and your accounting is. That gap is what we close.
If you want to know where your reps are driving for nothing, write to us. A short call is enough to see which systems you run and what a first report by region would look like on your own data.